We tested: Talend Enterprise Data Integration 5.4.1
The Talend Administration Center
We will now focus on the Talend Administration Center, the “engine room” of the product. This central Web-based solution manages and monitors jobs centrally. As mentioned earlier, we decided to concentrate on a few of the more interesting features, i.e. the execution plans, the Activity Monitoring Console (AMC) and error recovery. After that, we will describe the product’s general capabilities.
Execution plans
The jobs created with Talend Data Integration Studio can not only be distributed across and started on the execution servers available on the network using the Administration Center, but they can also be triggered and scheduled to execute automatically. In addition to this, Talend Data Integration has a feature called Execution Plans. These plans ensure that different jobs are executed in a particular linked sequence and that the authorized users can deploy several jobs in parallel. All they need to do is create an execution plan, give it a name and add the tasks to be executed. The user than starts the execution plans in the same way as individual jobs, either manually or by setting triggers or schedules.
This interlinking and parallel execution of jobs is very useful in practice. For example, the functionality allows users to collect data in parallel from multiple sources and add and transform them later on a routine basis.
As well as this, Talend lets the user add tasks to the execution plans that are only to be executed if the previous task – for example the collection of data – has been completed successfully, or tasks that only become active if an error has previously occurred. In addition, jobs can themselves call other jobs. So the execution plans are a very useful way to execute a variety of tasks automatically in all types of scenarios, which are easy to set up and manage. We encountered no difficulties when working with the execution plans during our test.
Activity Monitoring Console
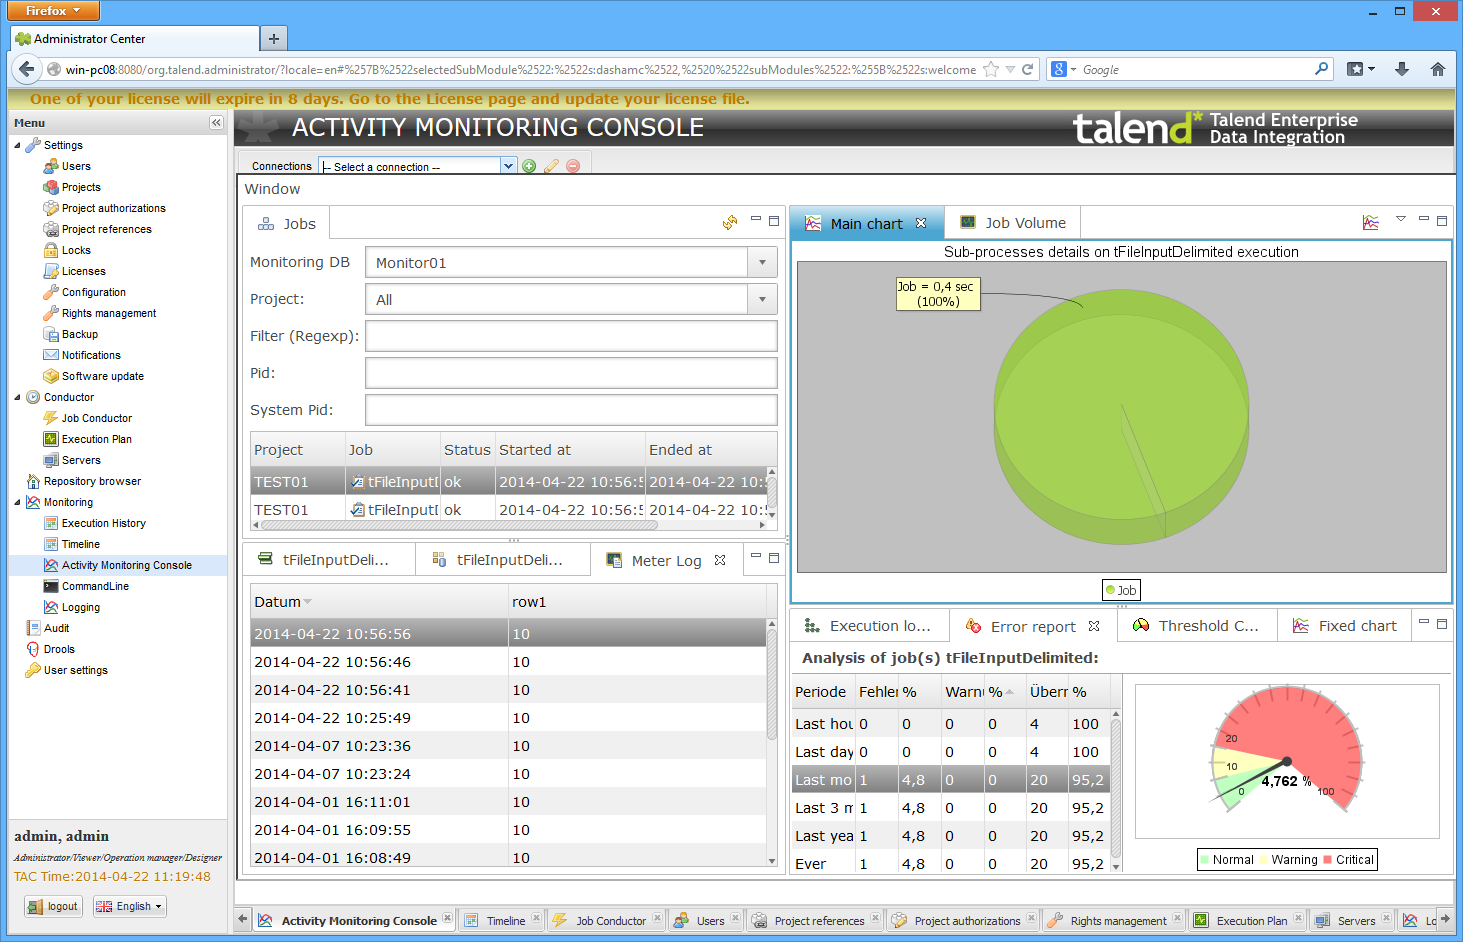
Another interesting feature is the Activity Monitoring Console (AMC). The AMC stores all the data it collects when monitoring the entire system. This data is kept in a database for future reference so that activities of the previous month, for example, can be checked. For the test, we used a MySQL system as the database for the AMC. The database ran on a different server in the network on Linux.
The AMC stores job execution information, including the duration, any messages issued and so on. It also provides an overview of logged events and an error report.
If the user selects a job from the list of executed tasks, they will see additional execution details such as an overview of the individual steps carried out.
The AMC also provides a metering log which provides comprehensive stats information on data transferred within a given job. This requires tFlowMeter, for example, components to have been integrated at suitable points in the job during its development. These components measure the data transferred and forward these stats to the monitoring tool. If required, they can also be assigned thresholds, for example to control when entries in the AMC are to be color-coded. This is useful to indicate when loads are too high, for instance.
Various graphical elements provide overview information on a selected task, including execution time, thresholds or the error count. There is also a possibility of collating information – for example the execution times of different jobs – in a graphic.
The AMC also generates pie charts showing the executed time for each component. The components shown can include those for collecting data or creating rows in a database. For this to work, however, the user must have activated Activity Monitoring for their project or job in Data Integration Studio. Alternatively, they can integrate monitoring elements like the above-mentioned tFlowMeter component directly into the job design.
During our test, we encountered no difficulties when working with the AMC. The data collection step worked straight off and it was very easy to carry out routine tasks with the monitoring solution. Extensive filter functions ensure that in practice employees will only ever see the data they are interested in. The graphics, too, can always be customized to the user’s requirements.
Error recovery
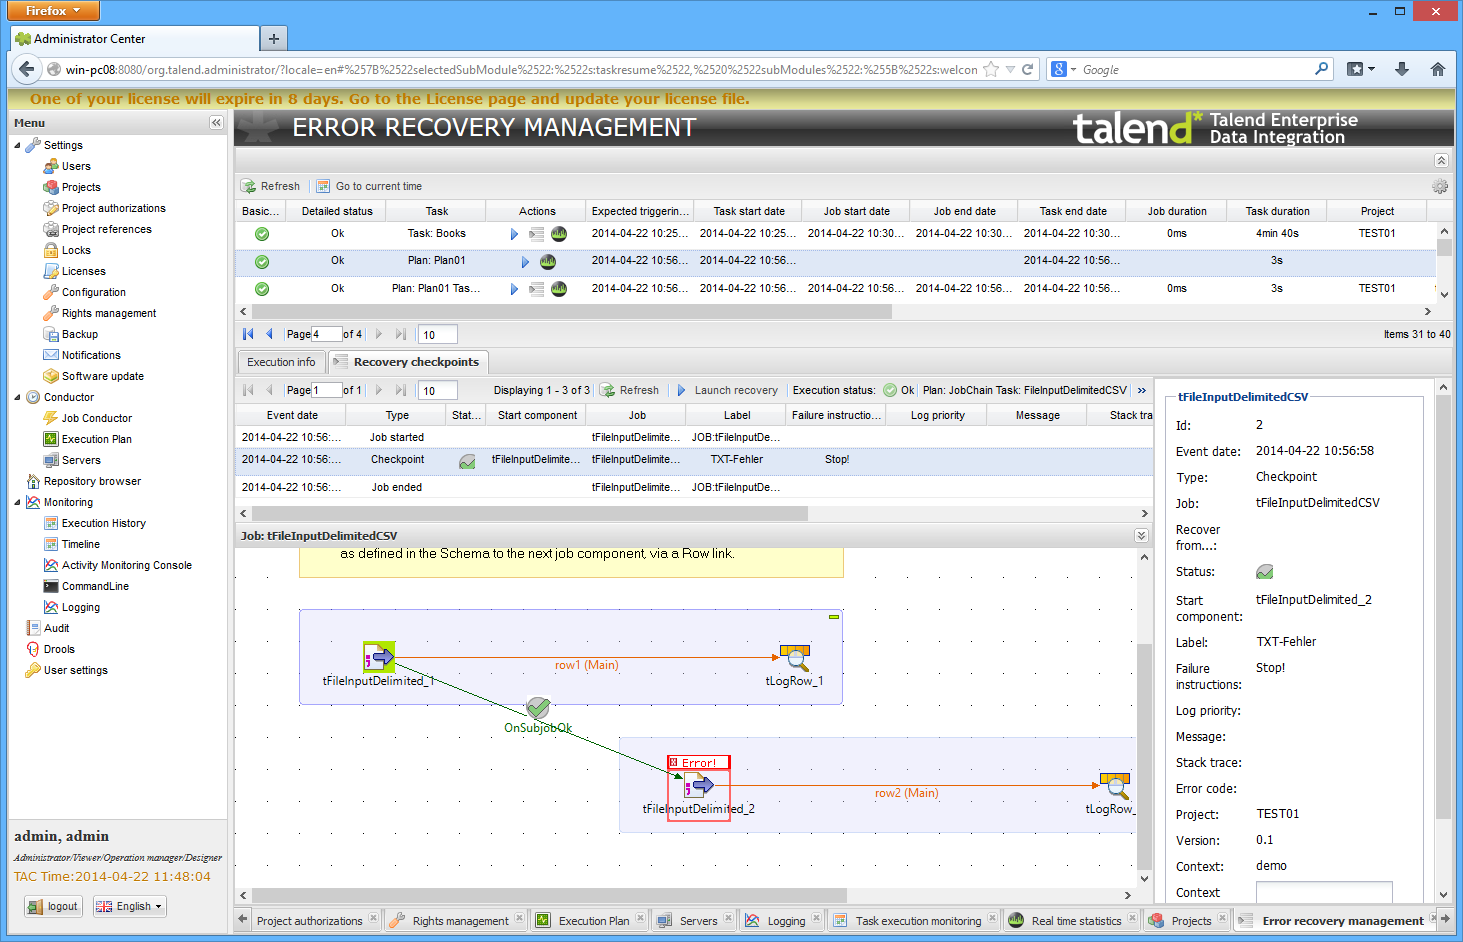
We will now turn to the functions for dealing with errors. To aid the user here, Talend Enterprise Data Integration provides checkpoints which allow users to start the execution of jobs at any point in the code – i.e. not necessarily at the beginning. These checkpoints are a useful time-saving measure if jobs interrupted by errors have to be executed again. The checkpoints can be defined in Data Integration Studio and then used in the Administration Center.
Users can also access the Error Recovery Management page in the Administration Center. They are first presented with a list of available jobs. When the user selects one of these, the system displays the associated execution information such as start time or job server. The Recovery Checkpoints tab allows the user to access both the checkpoints set for the job and the associated execution logs. If the job was interrupted because of an error, it can be executed again from the same point based on the last checkpoint by clicking Launch Recovery.
Other functions of the Administration Center
Finally, we will briefly describe the remaining functions of the Administration Center. After logging in, the user is presented with a home page on a Web interface. The left-hand side contains a menu tree view where administrators can easily access all the tool’s functions. The first menu item under Settings contains user management options. This is where the administrator can create user accounts with different rights to determine employees’ permissions for working with the data integration solution. The different roles that can be assigned to users are Administrator, Operation Manager, Viewer and Designer. There is also the option of assigning individual rights such as Project Visualization, CommandLine, License Management or Project Management Audit Visualization to the roles under Rights management, thus defining the permissions very specifically. User accounts can also be imported if required.
The individual data integration projects are managed under Projects, where they can be created, duplicated and deleted. Authorized users can also enter information like the project author and repository.
Users can be added to a project under Project Authorizations. Under Project References, the user can create projects that can be referenced from other projects. The Locks menu item shows existing lock entries. Users can also release the locks here. The purpose of the locks is to prevent other users making changes to the same item.
Settings is also where users access the Configuration page, as we did during the installation, described previously. This is where the individual components of the data integration solution are set up. These components include the CommandLine, the database, the Job Conductor, SVN and Log4j.
The other Settings menu items allow users to save the database, manage the license and set up notifications. The different types of notifications include automatically informing new users that their account has been opened or informing existing users of failed tasks or available patches.
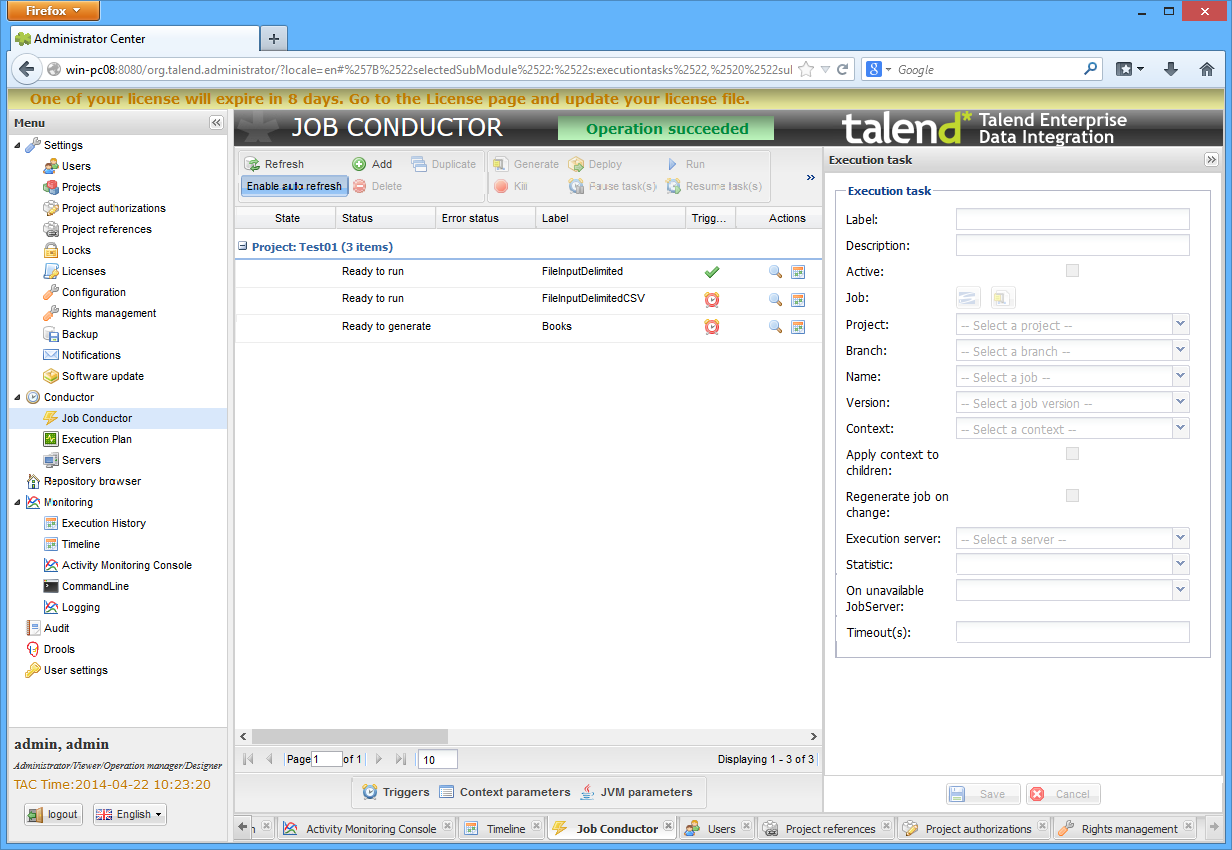
The second menu heading of Conductor contains functions for creating, generating, distributing, executing, pausing, resuming and stopping jobs. This is where authorized users deploy jobs and ensure that they have been executed correctly. It is also where the execution servers are managed. New servers are configured here and the available memory and disk capacities are displayed. The previously mentioned management of the execution plans are also located under Conductor.
The Repository Browser allows the user to look through the repositories of individual projects, accessing the content of the Repository tree view as if they were logged on to Studio.
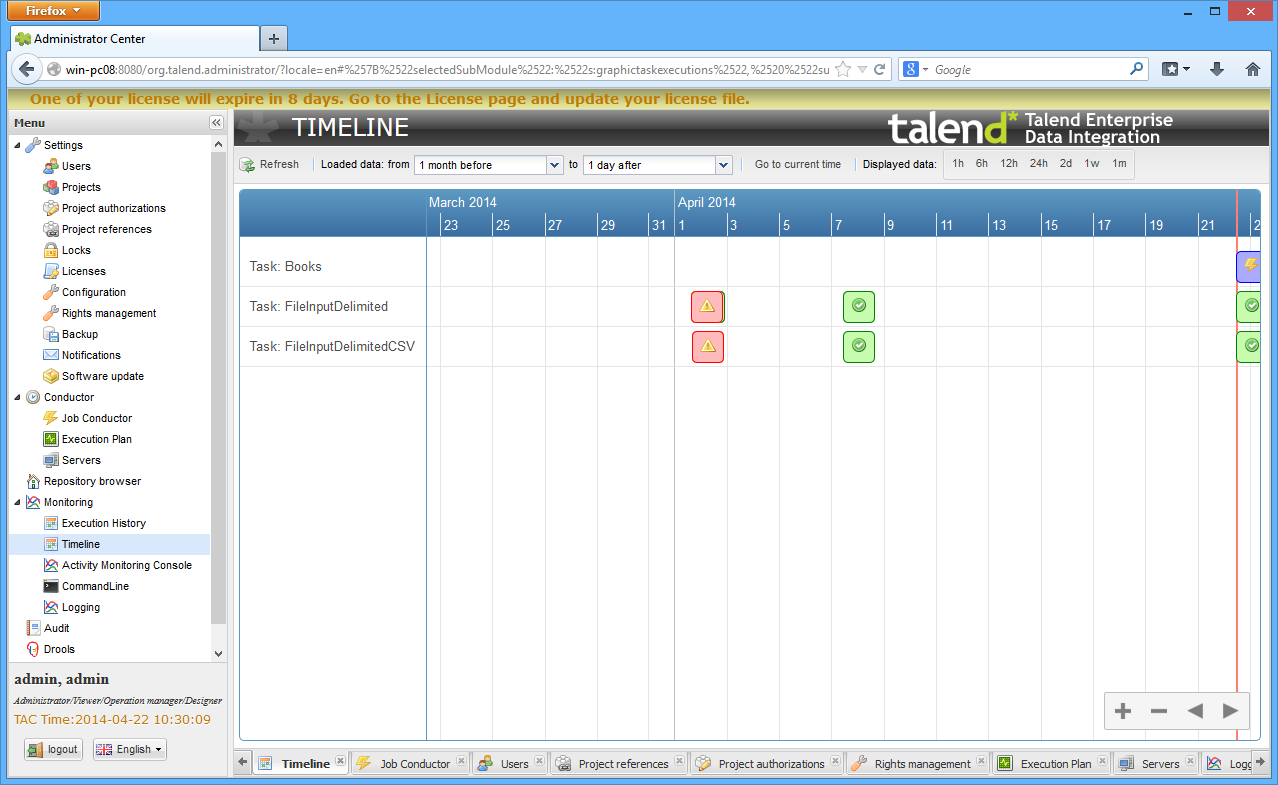
The monitoring functionality is also interesting. The Activity Monitoring Console has already been described but there is also an execution history showing when particular jobs were executed, any errors which may have occurred and other information. The Timeline provides similar information, though in the form of a graphical overview with color coding for jobs that were completed with and without errors. In addition, a list of current actions is displayed under CommandLine.
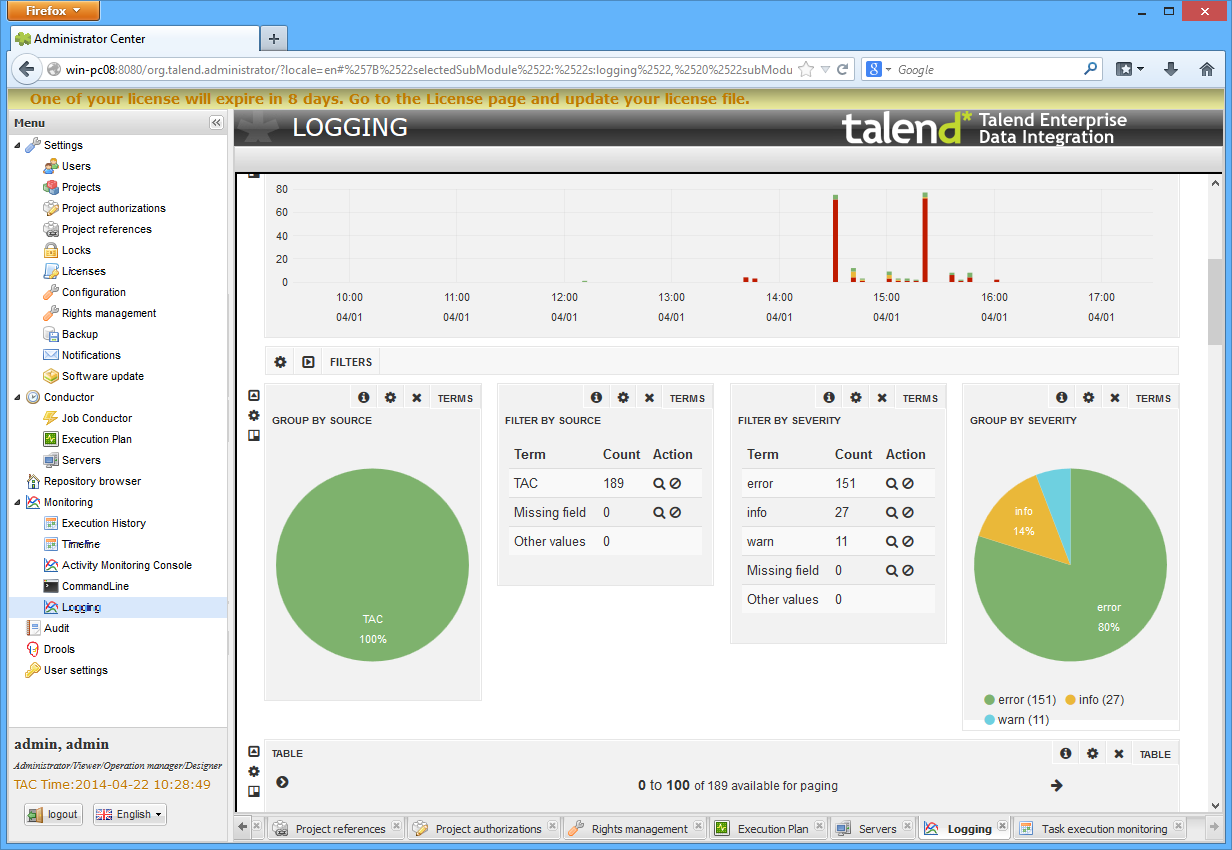
The Logging sub-item is particularly interesting. When the user selects this, they are presented with a dashboard page based on Kibana log analysis software. It provides information on the various log entries (subdivided into log levels such as error, warning, debug and info). The user can filter the data displayed by date or time and there is a comprehensive search function to help the user find important data. Added to this are a timeline and graphical elements like pie charts for visualizing the current status of the system. A table containing notifications and error messages also helps the user access the log information. The dashboards can be customized at any time and there is also the option of deleting and adding dashboards.
The Audit and Drools menus complete the range of functionalities delivered by the Administration Center. The audit tool evaluates projects, collecting information on all job operations and checking that the job works efficiently. It then generates a PDF file with comprehensive data on the individual components. Drools is a Business Rule Management System (BRMS).
Summary
We were very impressed by how Talend Enterprise Data Integration performed in our test. With this development environment and its components, even inexperienced users will be able to configure complex data transformation jobs. The Administration Center offers authorized employees a central interface to manage and monitor jobs across distributed environments. The solution also has good error recovery capabilities. The overall impression was that this is a very powerful and versatile solution. Despite the large number of functions and complexity of the product, it is easy to use and ticks just about every box. For that reason we give it the “IAIT Tested and Recommended” rating.
[subscribe2]